
Currently Empty: ₹0.00
Self Paced Course Power BI

Industry-Recognized Certification
Earn professional certificates upon course completion that validate your skills and strengthen your resume for real-world opportunities.

Concept-Focused Learning
Gain a strong understanding of core concepts through structured lessons and real-world examples in our AI & data analytics course, designed to build clarity, practical knowledge, and confidence for real-world business and analytics applications.

Career Growth & Skill Advancement
Upgrade your skills with in-demand technologies and tools that help you stay competitive and unlock better career prospects.

Affordable & Flexible Learning
Access high-quality courses at competitive prices with lifetime access, allowing you to learn at your own pace, anytime, anywhere.

|
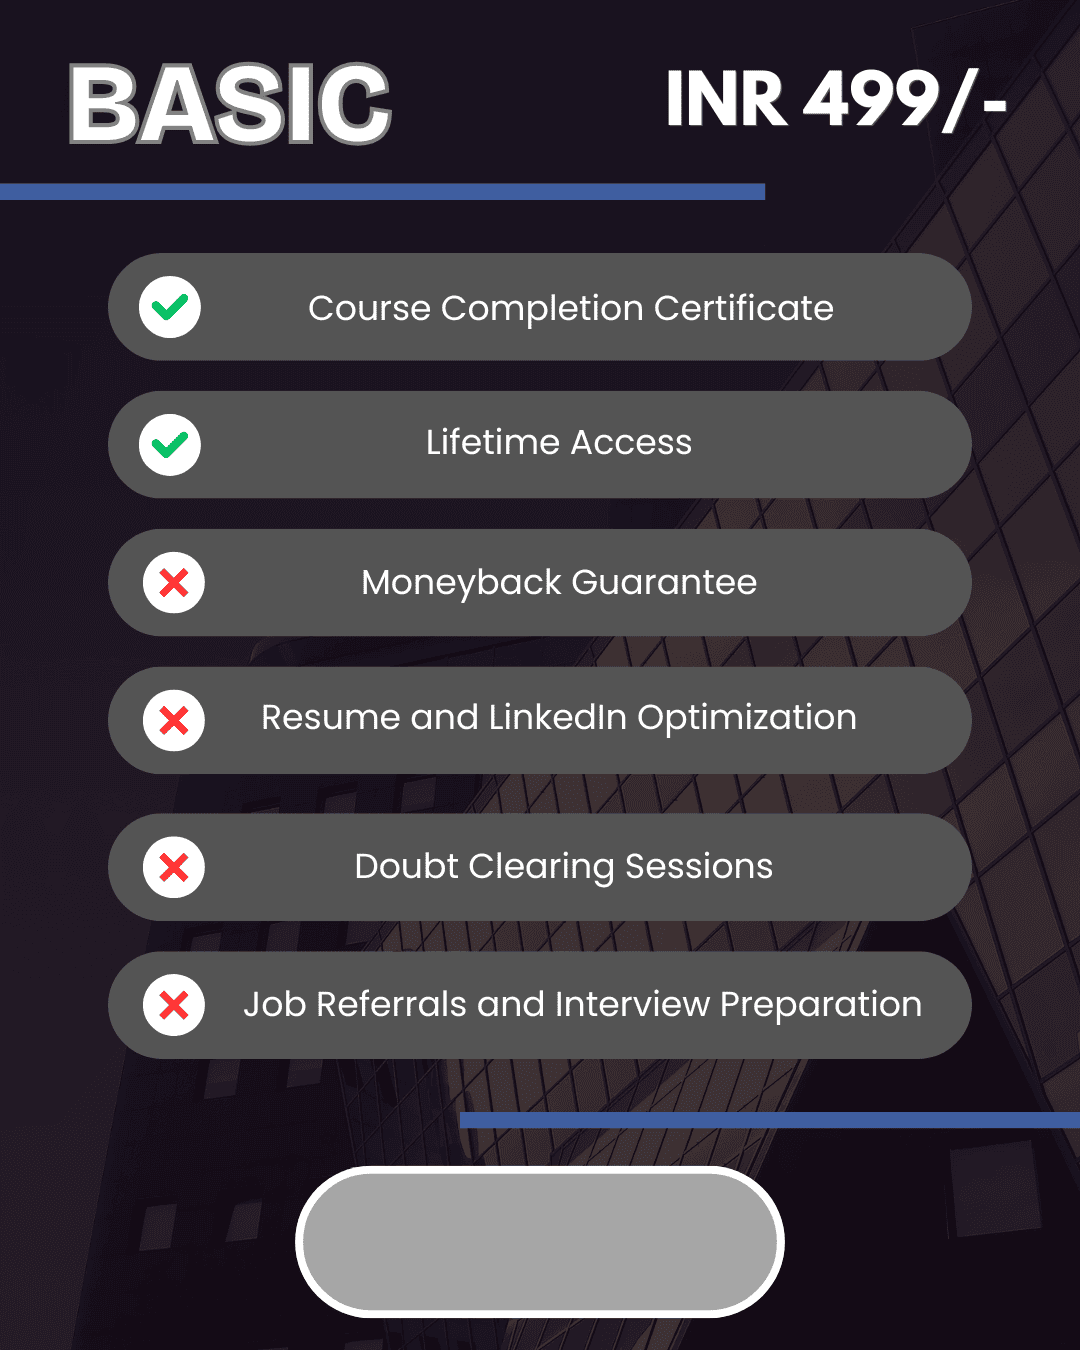
BASIC
|
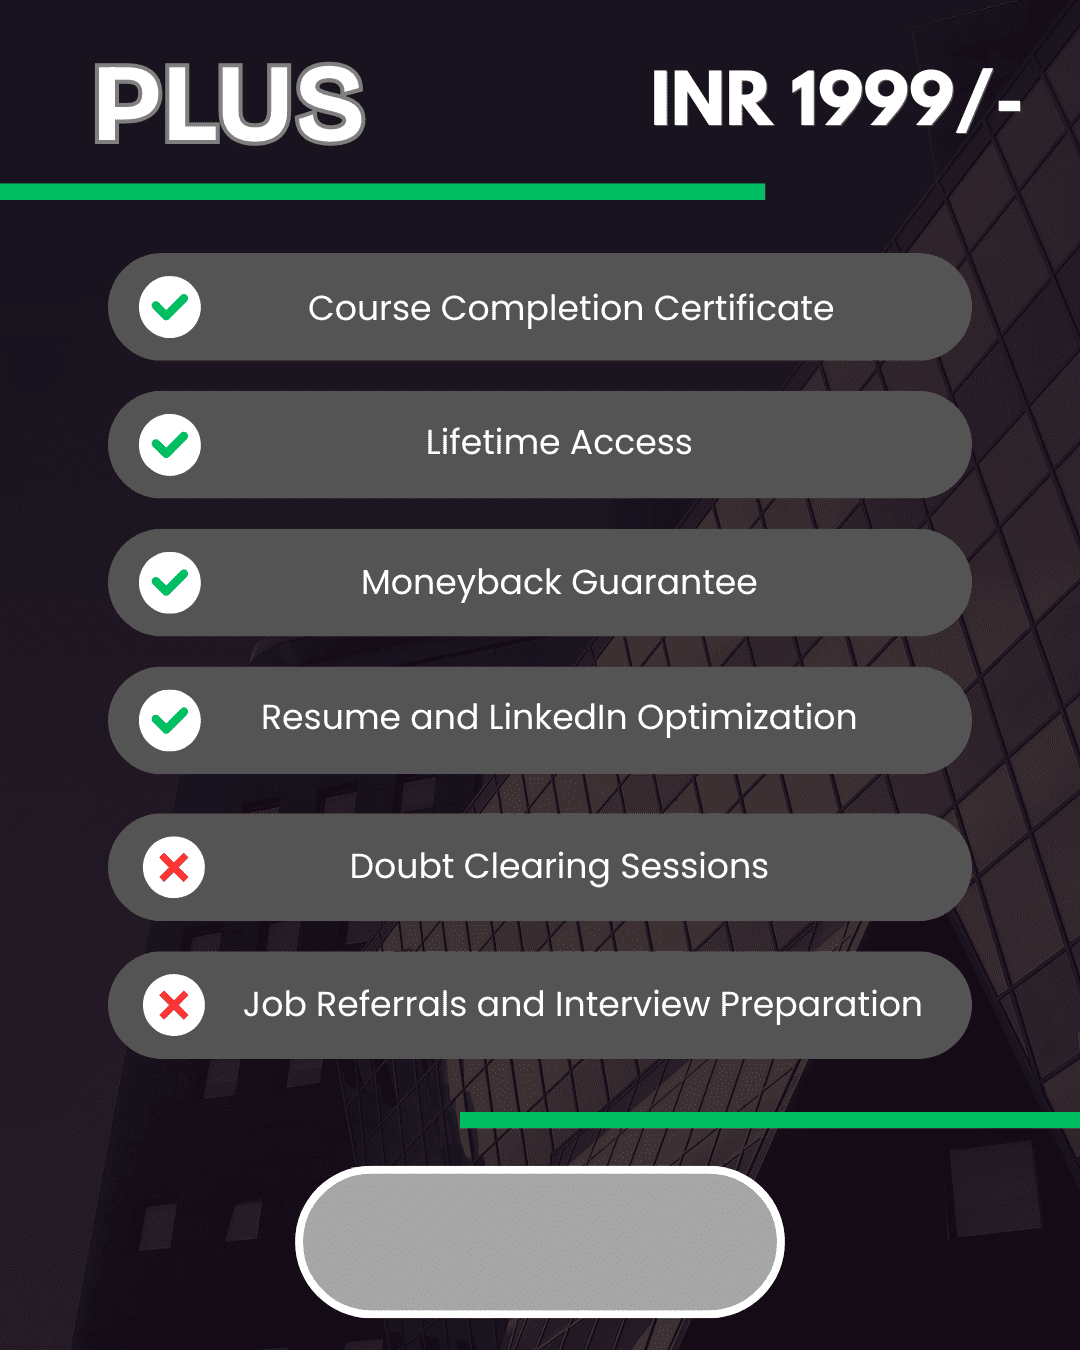
PLUS
|
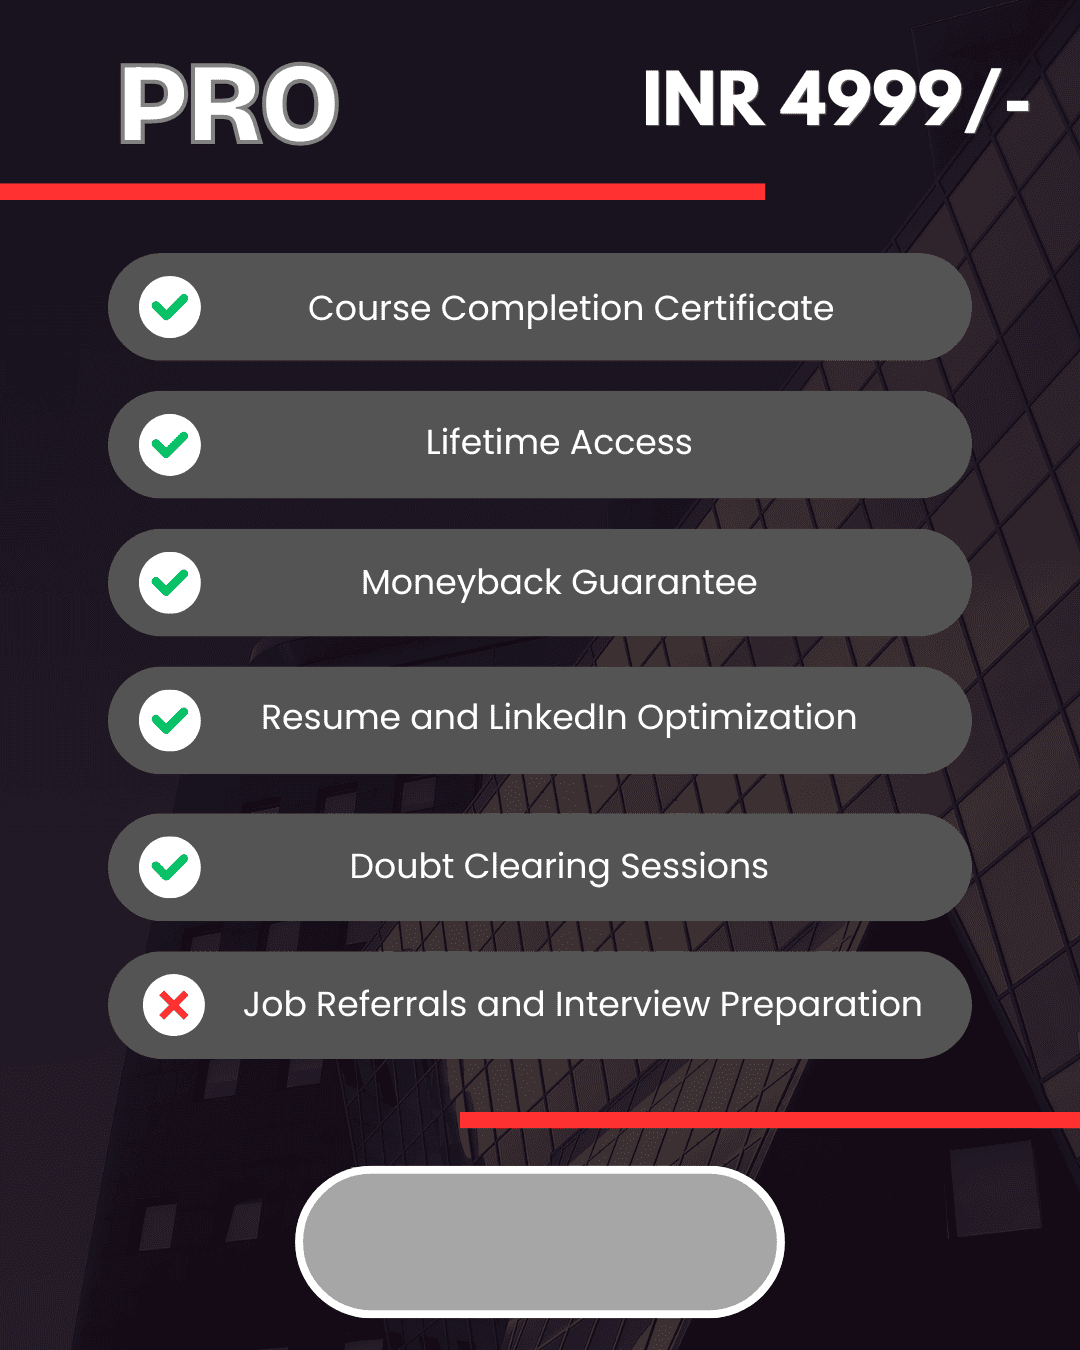
PRO
|
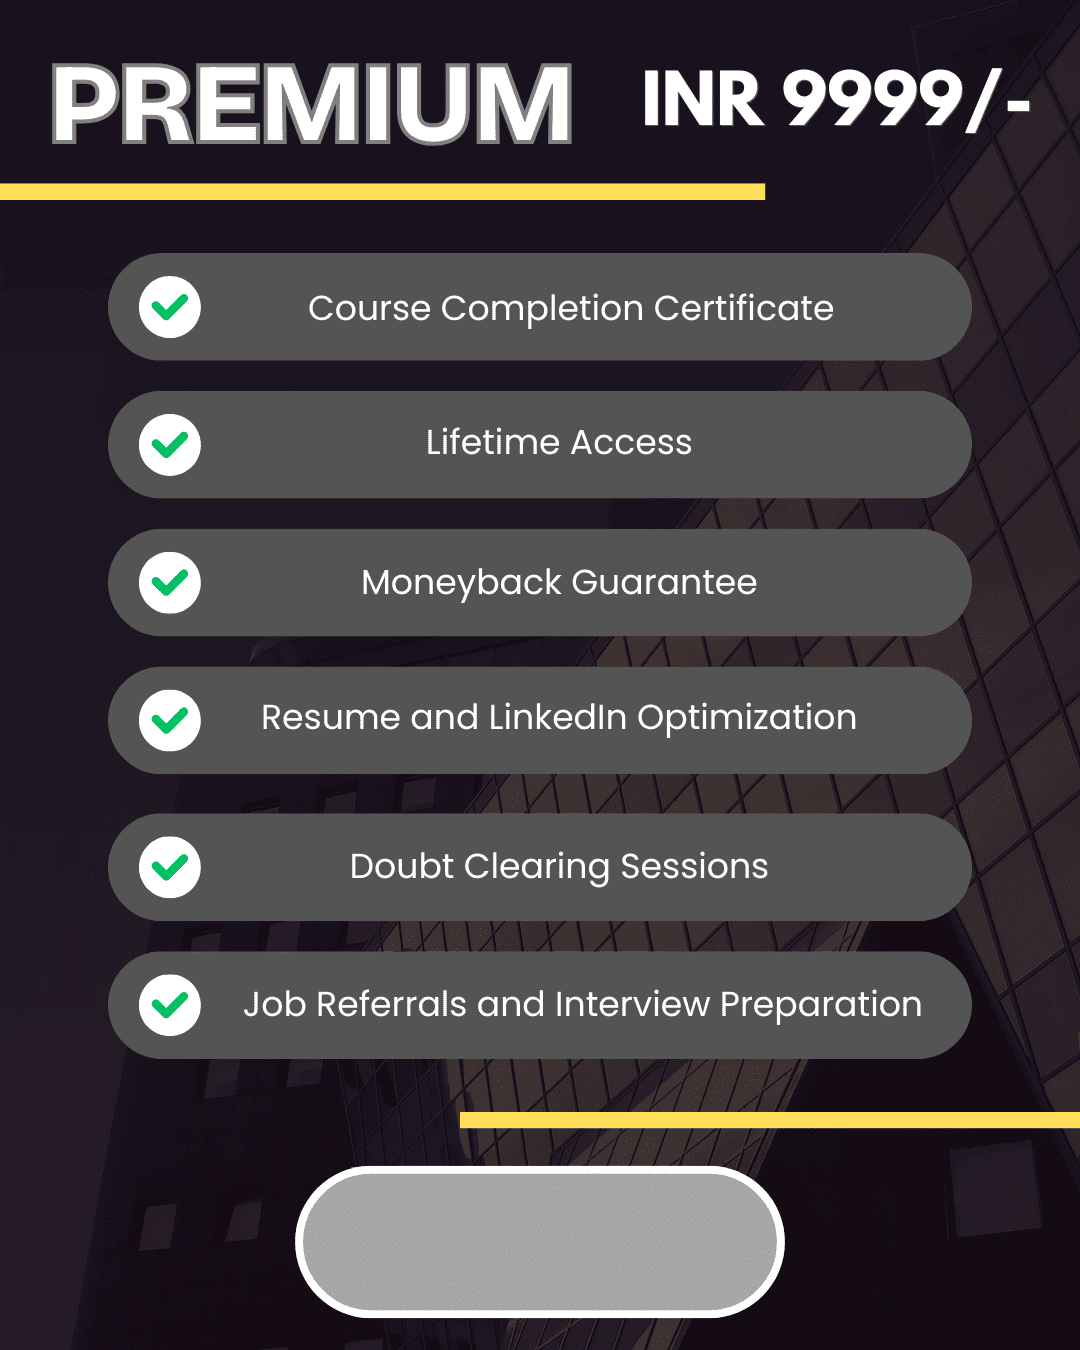
PREMIUM
|
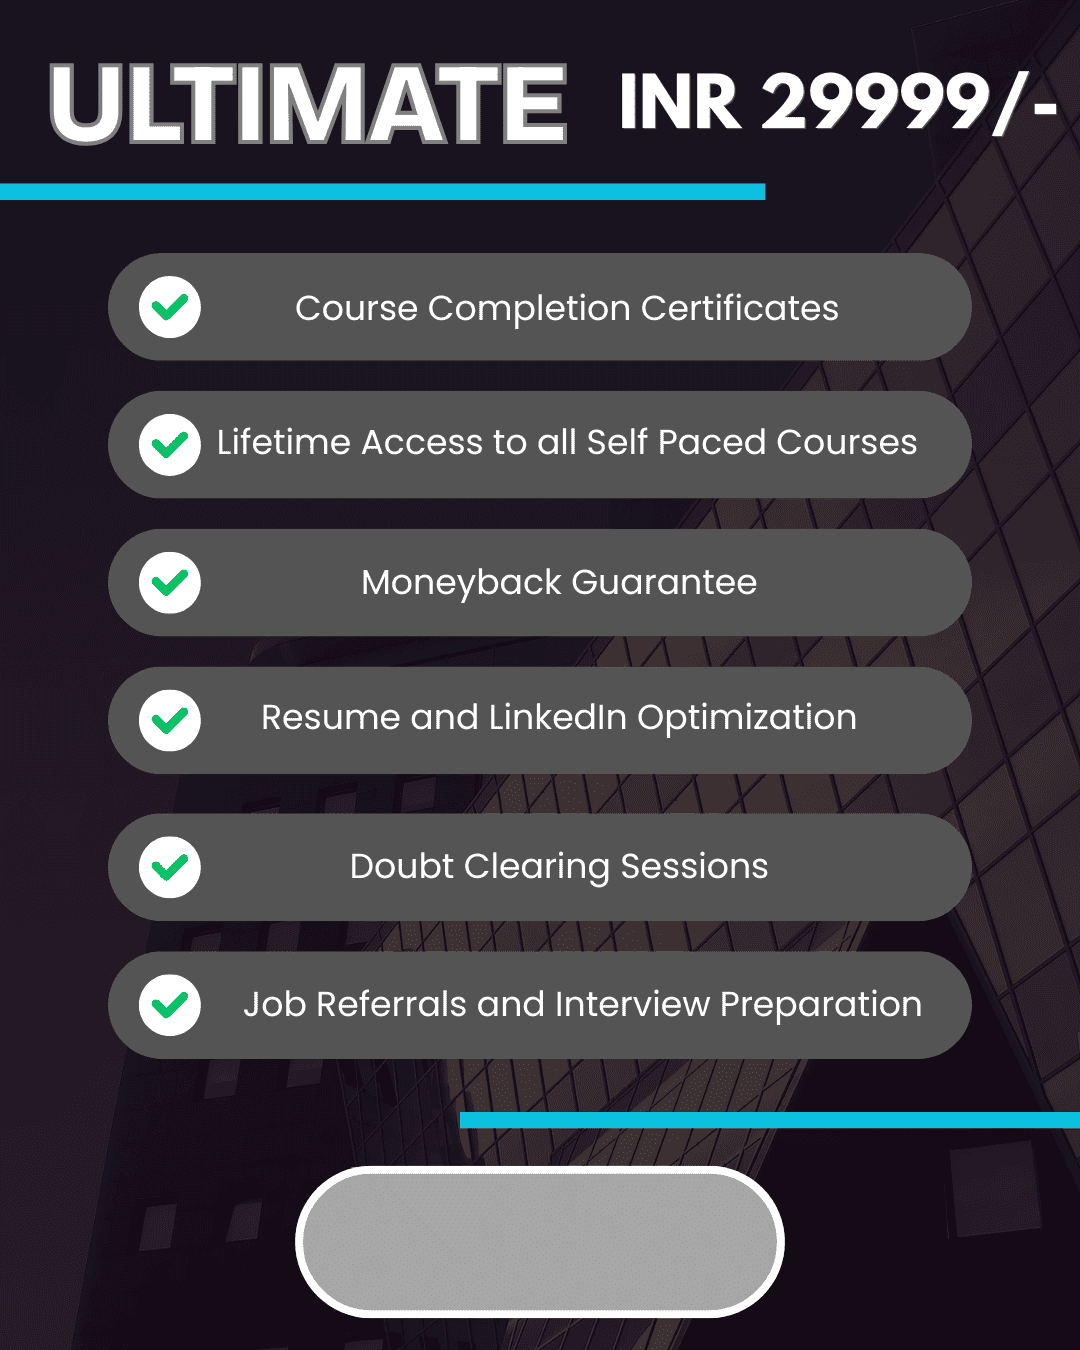
ULTIMATE
|
|---|---|---|---|---|
|
Course Completion Certificate
|
Course Completion Certificate
|
Course Completion Certificate
|
Course Completion Certificate
|
Course Completion Certificate
|
|
Lifetime Access
|
Lifetime Access
|
Lifetime Access
|
Lifetime Access
|
Lifetime Access
|

|
(7 Days) Moneyback Guarantee
|
(10 Days) Moneyback Guarantee
|
(30 Days) Moneyback Guarantee
|
(60 Days) Moneyback Guarantee
|
|
|
Resume & LinkedIn Optimization
|
Resume & LinkedIn Optimization
|
Resume & LinkedIn Optimization
|
Resume & LinkedIn Optimization
|
|
|
|
1:1 Doubt Clearing Sessions
|
1:1 Doubt Clearing Sessions
|
1:1 Doubt Clearing Sessions
|
|
|
|
|
Job Referrals and Interview Prep
|
Job Referrals and Interview Prep
|