- Live Class : Google meet
- Date : February 07′ 2026
- Time : 04:00pm – 06:00pm
What Will You Learn?
- Learn from industry-experienced instructors who bring real-world insights and best practices to every session.
- Gain a solid understanding of Power BI’s interface and key components.
- Connect and import data from diverse sources including Excel, SQL databases, and web services.
- Understand data types, structures, tables, columns, and relationships within Power BI.
- Clean, transform, and prepare your data using the Power Query Editor.
- Build effective data models with calculated columns, relationships, and measures.
- Write DAX (Data Analysis Expressions) to perform advanced data calculations.
- Visualize data with charts, tables, KPIs, and custom visuals.
- Enhance report interactivity using filters, slicers, and bookmarks.
- Design and publish dashboards for sharing across your organization.
- Leverage Power BI’s built-in AI tools to uncover deeper insights.
- Schedule data refreshes and automate updates for real-time reporting.
- Apply best practices in report design for clear and impactful storytelling.
- Troubleshoot performance and data-related issues efficiently.
- Work on real-world projects to apply your skills and build your portfolio.
- Prepare for Power BI roles with hands-on exercises and job-ready experience.
- Join now to learn from experts and take your Power BI skills to the next level with practical training that’s aligned with industry demands.
Material Includes
- Live instructor-led sessions with industry-experienced professionals.
- 15 hours of on-demand live classes recorded video content to learn at your own pace.
- A comprehensive capstone project to apply your skills in a real-world scenario.
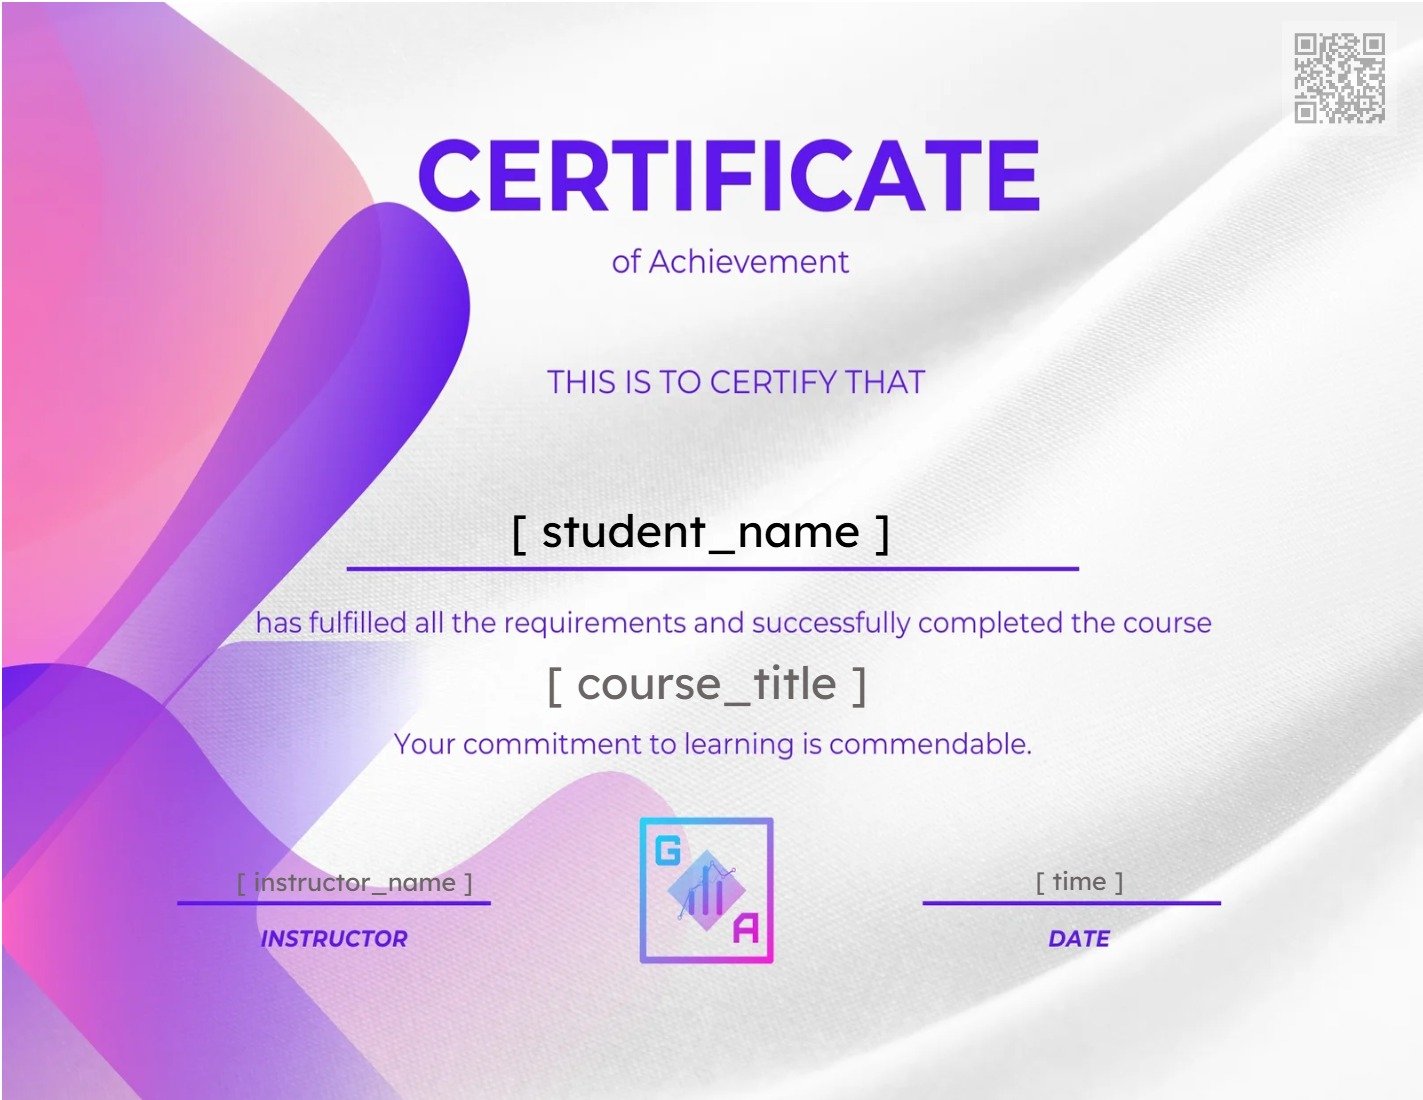
- Certificate of Achievement post course completion
Requirements
- Basic Computer Skills: Familiarity with using a computer, internet browsing, and file management.
- Microsoft Power BI Desktop: You will need to download and install the free version of Power BI Desktop from the official Microsoft website.
- Ensure your system meets the minimum requirements for Power BI Desktop (Windows 8 or later, 1 GB RAM minimum, 2-core processor or better).
- Access to Data: You will need some basic datasets (e.g., Excel, CSV) to work with. We’ll guide you on how to connect to various data sources.
- Basic Excel Knowledge (optional but helpful): Familiarity with Excel functions and data structures (e.g., tables, pivot tables) will help you grasp data manipulation concepts quicker.
- No Programming Experience Required: This course is beginner-friendly, and you do not need any prior programming knowledge to get started.
- Internet Access: Some sections of the course may involve downloading additional resources or datasets, so internet access is necessary.
Audience
- Business Analysts: Professionals who analyze data and create insightful reports to support decision-making.
- Data Analysts: Those aiming to deepen their expertise in data modeling, visualization, and reporting with Power BI.
- Managers and Executives: Leaders who want to confidently interpret Power BI reports and dashboards for data-driven decisions.
- IT Professionals: Individuals seeking to broaden their knowledge of business intelligence and Power BI for efficient data management.
- Finance Professionals: Experts needing advanced analysis techniques to build financial reports and forecasts using Power BI.
- Consultants: Advisors helping clients turn raw data into actionable insights through Power BI.
- Aspiring Data Scientists: Learners looking to boost their data manipulation and visualization skills within their data science toolkit.
- Students and Beginners: Anyone new to Power BI who wants to quickly learn how to create impactful visualizations and automate reporting.
- Small Business Owners: Entrepreneurs eager to leverage Power BI for informed business decisions without needing deep technical skills.
- Project Managers: Professionals managing project data and generating stakeholder reports using Power BI.
Course Content
Module 1: Power BI Walkthrough & Set Up
-
Introduction to Power BI
-
Power BI Installation and Set Up
-
Power BI Interface Walkthrough
Module 2: Power Query Editor
-
Introduction to Power Query Editor (Walkthrough)
-
Basic Row and Column Operations
-
Split Column in Power Query Editor
-
Group By and Replace Operations
-
Different Data Types and Data Type Conversions in Power BI
-
Power Query Operations: Numeric and Date Operations
-
Power Query Operations: Text Operations
-
Power Query Operations: Miscellaneous Operations
-
What is Transpose in Power BI?
-
Conditional Statements in Power BI
-
Indexing and Manage Duplicate Values in Power Query Editor
-
How to combine data in Power Query Editor?
-
How to save and close your applied steps in Power Query Editor?
Module 3: Reporting and Dashboarding in Power BI
-
Building our First Visual
-
Qualitative vs Quantitative Data
-
Univariate Analysis
-
Bivariate & Multivariate Analysis
-
Bar Charts & Column Charts
-
How to save your work in Power BI?
-
Basic Formatting in Power BI
-
100% Stacked Bar & Column Chart
-
Trend Analysis via Different Charts
-
Pie Chart, Donut Chart & Funnel Chart
-
Scatterplot: Univariate Analysis
-
Scatterplot: Bivariate Analysis
-
Slicers in Power BI
-
Map, Filled Map & Tree Map
-
Cards in Visualization
-
Table in Reporting
-
Exploring Cards with Date Field
-
Multi Row Card
-
Matrix in Visualization
-
Exploring Filters in Power BI Dashboard
-
Walkthrough Miscellaneous Visuals
Module 4: Data Modeling and Schema’s
-
What is Data Modelling?
-
Data Flow Concept
-
Creating your First Data Model
-
Relationship Concept in Data Modelling
-
How to handle Ambiguity in Data Modelling?
-
What is Schema in Data Models?
-
Star Schema
-
Snowflake Schema
Module 5: Data Analysis Expression (DAX)
-
Exploring Data Analysis Expression
-
What are Calculated Columns and Measures?
-
Aggregation Functions
-
Filter Context
-
Writing DAX Functions: Text, Logical & Switch
Module 6: Understanding Power BI Dashboard Publishing, Report Sharing and Security
-
Gauge Chart
-
Understanding Row Level Security (RLS) Concept
-
Real World Dataset Platform (Kaggle)
-
LinkedIn Updates
Earn your Geeks Analytics Certificate!
Geeks Analytics certificate validates your skills and boosts your credibility in the Data Industry.


