Many beginners think data analytics is just about creating charts. In reality, analytics follows a structured data analytics workflow that transforms raw data into meaningful insights and reports.
Understanding this workflow is essential for anyone aspiring to work as a data analyst.
What Is a Data Analytics Workflow?
A data analytics workflow is a step-by-step process that includes:
- Data collection
- Data cleaning
- Data exploration
- Analysis
- Visualization
- Reporting and insights
Each step is critical in the analytics lifecycle.
Step 1: Data Collection
Data can come from:
- Databases
- APIs
- Surveys
- Excel files
- CRM or ERP systems
Quality analytics starts with relevant and reliable data.
Step 2: Data Cleaning and Preparation
Raw data is often messy.
This step involves:
- Removing duplicates
- Handling missing values
- Correcting inconsistencies
- Formatting data properly
Data cleaning often takes 60–70% of an analyst’s time.
Step 3: Exploratory Data Analysis (EDA)
EDA helps analysts:
- Understand data patterns
- Identify trends and outliers
- Test assumptions
- Discover relationships
EDA builds the foundation for deeper analysis.
Step 4: Data Analysis
This is where insights are generated.
Techniques include:
- Descriptive analytics
- Diagnostic analysis
- Trend analysis
- Comparative analysis
The goal is to answer business questions clearly.
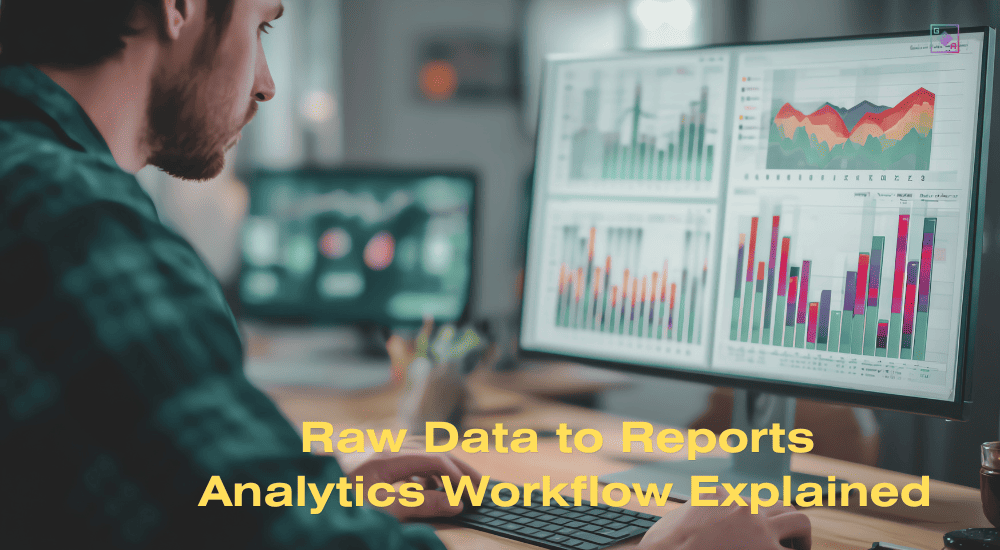
Step 5: Data Visualization
Visualization helps stakeholders understand insights quickly.
Common tools:
- Power BI
- Tableau
- Excel charts
- Python libraries
Good visuals support the storytelling process.
Step 6: Reporting and Communication
The final step of the analytics workflow is reporting.
Reports should include:
- Key findings
- Business implications
- Actionable recommendations
This step turns analysis into decision-making power.
The Analytics Lifecycle in Real Projects
In real-world projects, the workflow is iterative:
- New questions arise
- Data gets refined
- Insights evolve
Analytics is not linear; it’s adaptive.
Common Mistakes in Analytics Workflow
- Skipping data cleaning
- Jumping to conclusions
- Overcomplicating analysis
- Poor reporting structure
Avoiding these improves analysis quality.
Why Freshers Must Understand Analytics Workflow
Understanding workflow:
- Improves project execution
- Builds interview confidence
- Helps manage real-world analytics tasks
- Makes you job-ready faster
Interviewers often ask about the end-to-end process.
Final Thoughts
A strong grasp of the data analytics workflow helps analysts deliver consistent, reliable insights. From raw data to final reports, every step matters in turning data into value.